From Guesswork to Data: How Heatmaps Reveal Your Store's Hidden Revenue Zones
Retailers spend thousands on store layout design — planograms, end-cap displays, cross-merchandising zones — and then they fly blind. Without foot traffic data, a layout change is a leap of faith: you hope the new arrangement drives more sales, but you never know whether shoppers actually walked the new path, paused at the new display, or simply bypassed it entirely. Heatmap analytics turns layout optimisation from guesswork into a data-driven discipline.
xRetails xTrack Dome generates real-time heatmaps that show exactly where shoppers go, where they linger, and where they never venture. Each zone in the store is colour-coded by traffic density, revealing patterns that are invisible to the naked eye. A seemingly prime end-cap might sit in a low-traffic corridor. A corner shelf that looked like dead space could be one of the most visited spots during peak hours. Without this data, retailers are decorating rooms no one enters.
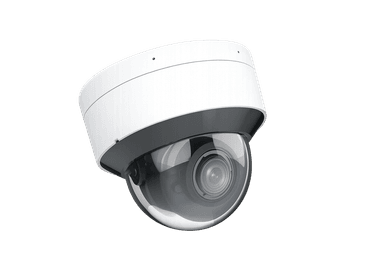
xTrack Dome
Real-time heatmaps and shopper journey tracking at the edge
Learn More →The actionable insights go far beyond display placement. Journey maps trace the most common paths shoppers take from entrance to checkout, revealing natural flow patterns and unexpected detours. Retailers discover that shoppers who enter from the left tend to follow a completely different route than those entering from the right — suggesting that mirror-image planograms on opposite sides of the store could double the exposure for promotional products. They learn that narrow aisles create unconscious avoidance behaviour: shoppers will skip an entire category if the passage feels cramped, even when the products are exactly what they came for.
For supermarkets, heatmap data is especially powerful in fresh food zones. By correlating dwell time in the produce section with basket size, operators can quantify the ROI of wider aisles, better lighting, or sampling stations. Stores that invested in heatmap-guided produce layout redesigns report 8–15% increases in fresh food sales — driven entirely by improved navigability and visibility, not by price changes or promotions.
Mall operators and shopping centre landlords also benefit from heatmap intelligence. By identifying which corridors, floors, and entrances generate the most foot traffic, property managers can optimise tenant placement, adjust lease pricing based on real exposure data, and redesign common areas to channel shoppers toward underutilised wings. The difference between a dead zone and a high-revenue zone is often a matter of sightlines, signage, and path design — all optimisable with the right data.
The technology behind heatmap generation is privacy-safe and deployment-friendly. xTrack processes all video locally on edge devices, extracting anonymised position data without storing any images or identifying information. The resulting heatmaps are aggregated across time windows — hourly, daily, weekly — giving operators both real-time visibility and long-term trend analysis. Deployment takes hours: mount the camera, point it at the zone, and the heatmap starts building within minutes.
In an era where every square foot of retail space must justify its cost, heatmap analytics is the compass that guides every layout decision. From planogram placement to aisle width, from entrance design to checkout positioning, the stores that win are the ones that can see what their shoppers actually do — not what they assume they do. xRetails makes that visibility immediate, actionable, and completely privacy-compliant.
Related Articles
Continue exploring insights from xRetails


Ready to Transform Your Retail Operations?
Discover how xRetails\' AI-powered IoT management and shopper analytics platforms can help your business reduce costs, increase revenue, and stay ahead of the competition.
Contact Our Team